Here are five economic reasons to be thankful this Thanksgiving. (Hat Tip to Neil Irwin who started doing this years ago)
1) The Unemployment Rate is Near 50 Year Low
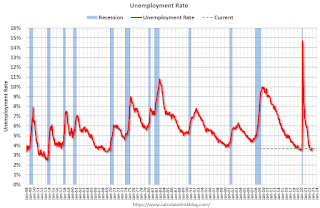 The unemployment rate was at 3.7% in October. The unemployment rate is down from 14.7% in April 2020 (the highest since the Great Depression).
The unemployment rate is down from 4.6% a year ago (October 2021).

This was just up from 3.5% in September - and that matched the lowest unemployment rate since 1969!
2) Low unemployment claims.
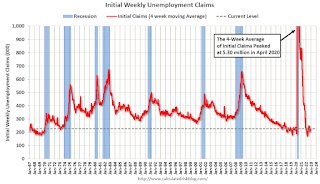 This graph shows the 4-week moving average of weekly claims since 1971.
2) Low unemployment claims.
 This graph shows the 4-week moving average of weekly claims since 1971.
Weekly claims were at 240,000 last week.
The dashed line on the graph is the current 4-week average.
The dashed line on the graph is the current 4-week average.
Even though weekly claims have moved up a little recently, the 4-week average is close to the lowest level in 50 years.
3) Mortgage Debt as a Percent of GDP is much lower than during Housing Bubble
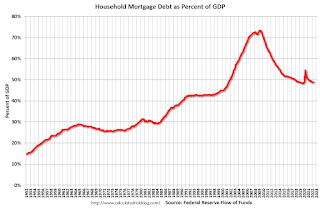 This graph shows household mortgage debt as a percent of GDP.
3) Mortgage Debt as a Percent of GDP is much lower than during Housing Bubble
 This graph shows household mortgage debt as a percent of GDP.
 Note this graph was impacted by the sharp decline in Q2 2020 GDP.
Mortgage debt is up $1.46 trillion from the peak during the housing bubble, but, as a percent of GDP is at 48.9%, down from a peak of 73.3% of GDP during the housing bust.
4) Mortgage Delinquency Rate at Lowest Level since at least 1979
Mortgage debt is up $1.46 trillion from the peak during the housing bubble, but, as a percent of GDP is at 48.9%, down from a peak of 73.3% of GDP during the housing bust.
4) Mortgage Delinquency Rate at Lowest Level since at least 1979

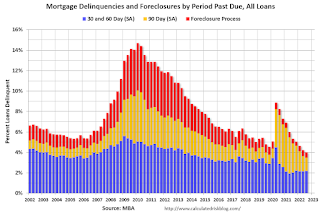
This graph, based on data from the MBA through Q3 2022, shows the percent of loans delinquent by days past due. Mortgage delinquencies were at the lowest level since the MBA survey started in 1979.
Note: The sharp increase in 2020 in the 90-day bucket was due to loans in forbearance (included as delinquent, but not reported to the credit bureaus).
The percent of loans in the foreclosure process increased year-over-year in Q3 with the end of the foreclosure moratoriums.
5) Household Debt burdens at Low Levels
 This graph, based on data from the Federal Reserve, shows the Total Debt Service Ratio (DSR), and the DSR for mortgages (blue) and consumer debt (yellow).
The Household debt service ratio was at 13.2% in 2007 and has fallen to under 10% now., and the DSR for mortgages (blue) are near the lowest level for the last 35 years.
This data suggests aggregate household cash flow is in a solid position.
This data suggests aggregate household cash flow is in a solid position.
Happy Thanksgiving to All!