Low Inventory Is NOT Fake News
April 25, 2023, 4:29 pm By Logan Mohtashami
Why are the homebuilder stocks up so much? Don’t they know the new home sales apocalypse is here? You know, the one that says we have too much inventory and millions of vacant homes in the U.S.? According to this theory, we have more homes under construction than any time in history. The truth is, it’s not 2008 all over again.
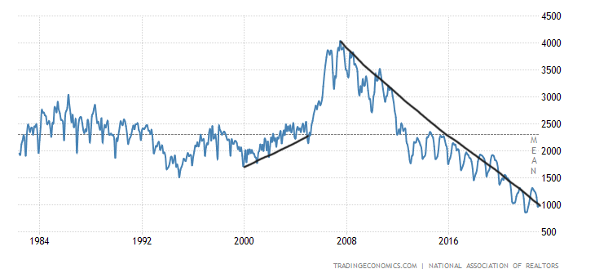
I understand the lure of the housing 2008 story. However, the people who say low inventory is fake news don’t realize that housing credit channels are very different from 2008, which has prevented total active listings from looking anything like 2008.
Certain people on Wall Street like to get ahead of the crowd by being early. In their haste, they miss the bigger picture of the housing market. There is a boring long-term story here about the total active listings being low in America, and I just don’t believe it’s a story that Wall Street wanted to discuss.
The chart below shows the number of active listings since 1982:
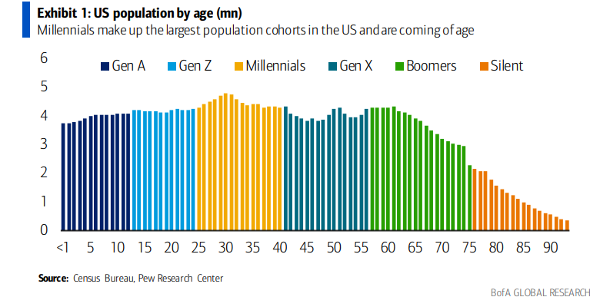
The people who told you demographics in the U.S. are awful and that we resemble Japan were drinking some powerful saki. For years, people said slowing U.S. population growth means we will become Japan, but I’ve been focused on demographics and how that will affect housing from 2020-2024. Concerning the housing economics demand curve, it’s always about the net people living and working.
In reality, housing economic modeling takes a lot of work, and some people instead choose marketing gimmicks to make a name for themselves. It’s very sexy to talk gloom and doom about the housing market, but sometimes that doesn’t end well. I have been highly skeptical of stock traders when they talk about housing economics.
And here is a case in point: New home sales came in Tuesday at a big beat of estimates, but the real story is one about supply and demand.
New home sales
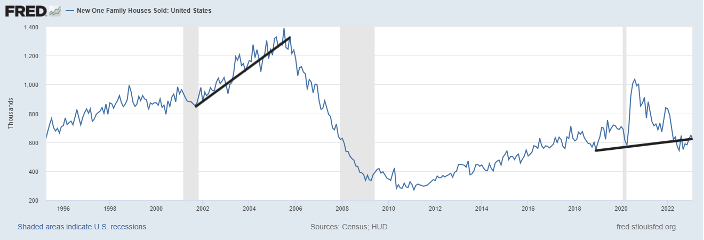
From Census: New Home Sales Sales of new single‐family houses in March 2023 were at a seasonally adjusted annual rate of 683,000, according to estimates released jointly today by the U.S. Census Bureau and the Department of Housing and Urban Development. This is 9.6 percent (±15.2 percent)* above the revised February rate of 623,000, but is 3.4 percent (±12.7 percent)* below the March 2022 estimate of 707,000.
As we can see in the chart below, it’s not like the new home sales market is booming at all; we aren’t anywhere near the top of sales in 2005 or in 2020. However, what has happened is that the housing data has stabilized.
When did this all happen? The forward-looking housing data started to improve from Nov. 9, 2022, with purchase application data, and almost everyone ignored it. The thing is, builders have time to work off their backlog of homes because they’re efficient sellers — they can cut prices, lower mortgage rates and do what they need to do to sell their product, which is a commodity to them. They don’t have the same issues as an existing homeowner because they’re not living in the home they’re selling.
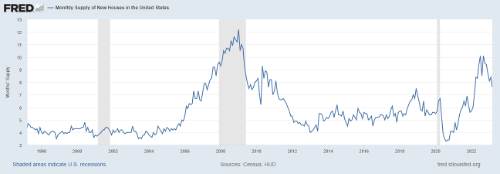
New Home Monthly Supply
For Sale Inventory and Months’ Supply, The seasonally‐adjusted estimate of new houses for sale at the end of March was 432,000. This represents a supply of 7.6 months at the current sales rate.
The builders are progressing here; their confidence improves as the monthly supply falls. Context is always crucial with all housing data, and we had a waterfall dive in many housing data lines and bounced from that deep dive.
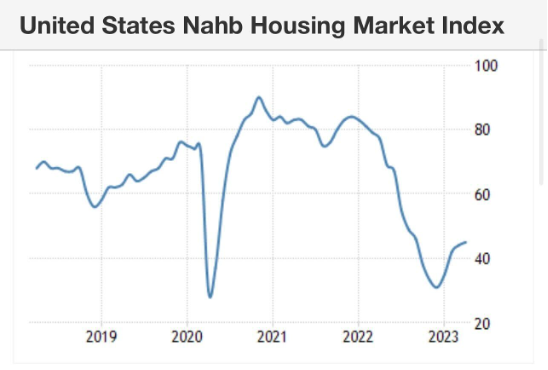
However, the housing market is still not good enough to start issuing new housing permits. That’s when you will know housing is out of the recession, and when the builders can start building again. It’s that simple.
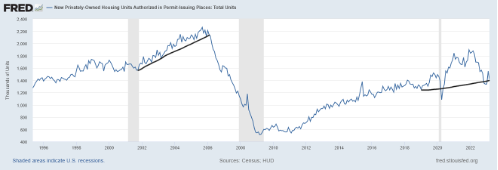
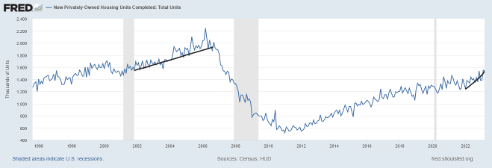
The data below is a significant improvement for builders, as housing completions are still rising while their monthly supply is falling.
I have a straightforward model for when the homebuilders will start issuing new permits with some kick and duration. My rule of thumb for anticipating builder behavior is based on the three-month supply average. This has nothing to do with the existing home sales market — this monthly supply data only applies to the new home sales market, and the current 7.6 months are too high for the builders to issue new permits with any natural steam.
- When supply is 4.3 months and below, this is an excellent market for builders.
- When supply is 4.4 to 6.4 months, this is an OK builder market. They will build as long as new home sales are growing.
- When the supply is 6.5 months and above, the builders will pull back on construction.
So, as we can see below, the homebuilders are no longer dealing with spiking supply data but a slow-moving downtrend that still needs much work. However, there is a lot more to this the active listing story than meets the eye.
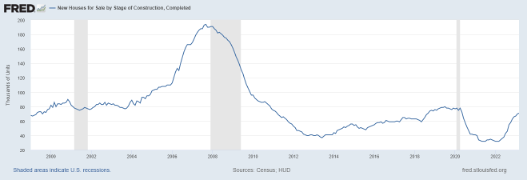
The 7.6 months of supply is broken down this way.
- 267,000 homes are under construction, still. 4.7 months of supply
- 94,000 homes still need to start construction. 1.7 months of supply
- 71,000 homes are completed for sale. 1.2 months of supply
No, I am not kidding you; the mass supply increase some people have been talking about is only 71,000. We are far from the peak of supply during the housing bubble crash nears, which was closer to 200,000.
All in all, Tuesday’s new home sales report is consistent with what we have seen in the new home sales data for many months now. The builders are simply taking advantage of the low total housing inventory by doing whatever it takes to move their product, and that is being helped by paying down the mortgage rate for their buyers. Imagine what the total housing market would look like if mortgage rates were at 5% today.
As part of the Housing Market Tracker, we look at seasonal inventory weekly, and hopefully, the seasonal inventory bottom has already happened, as I talk about here.
Regarding Wall Street’s take on the surprise in the new home sales sector, was it really a surprise? Someone had to be buying the builder stocks, right? The reality is that home sales crashed last year and that didn’t create the inventory that some housing experts were looking for last year and this year. This is where understanding how credit channels impact housing inventory would have helped.
Hopefully, my work during my time as a housing analyst for HousingWire has brought some light into this discussion, and this will be more in focus when the next recession hits. However, until then, the Housing Market Tracker data got ahead of this stabilization in new home sales data, and that shouldn’t have surprised Wall Street.