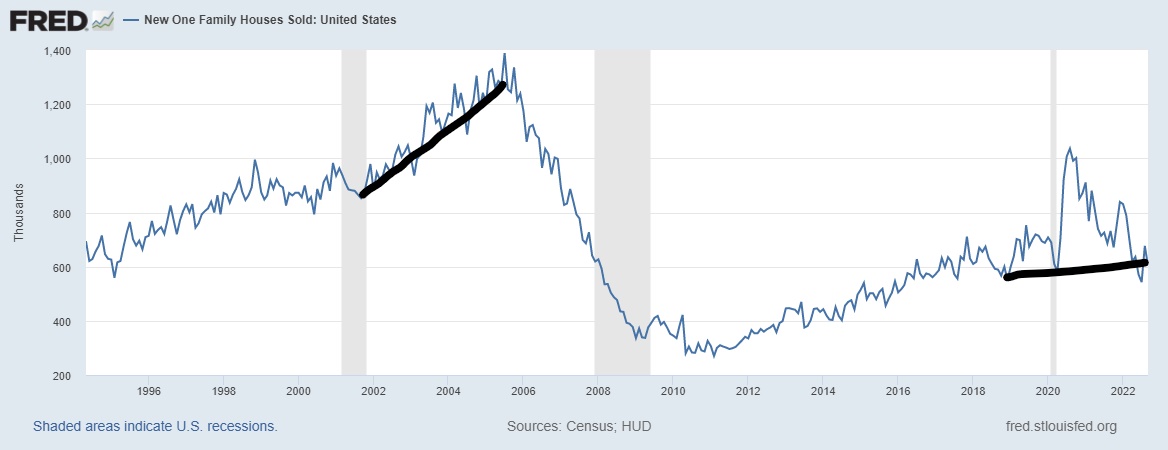
Sales are already historically low, back to 1996 levels when rates were near 8%
October 26, 2022, 4:26 pm By Logan Mohtashami
September new home sales beat expectations, but don’t get too excited. While monthly supply rose in this report, the previous reports were all revised lower and sale levels are still historically low. New home sales are now below the recession levels of 2000 and have fallen all the way to 1996 levels, when interest rates were near 8%.
As I have always tried to stress with home sales data, we have not had a massive credit sales boom like the one we saw during the housing bubble years, so we can’t have a similar huge sales bust working from such historically high levels. This is a positive in the sense that this downturn is more manageable: sales weren’t elevated with a credit boom boosted by exotic loan debt structures, so finding that bottom level in sales is more reasonable.
From Census: New Home Sales of new single-family houses in September 2022 were at a seasonally adjusted annual rate of 603,000, according to estimates released jointly today by the U.S. Census Bureau and the Department of Housing and Urban Development. This is 10.9 percent (±15.2 percent)* below the revised August rate of 677,000 and 17.6 percent (±15.9 percent) below the September 2021 estimate of 732,000.
During the housing bubble years, new home sales, housing starts, prices and credit demand boomed to an extreme level. This was a very unhealthy setup because demand couldn’t sustain itself, and new home sales and starts were set up for a significant, rapid decline. As you can see below, we aren’t working from elevated levels today.
This doesn’t mean sales can’t fall further from here, especially with rising mortgage rates. However, it shows that the builders are better at managing their supply and demand imbalances compared to the housing bubble years. We saw some stabilization in the data when mortgage rates fell from 6.25% to 5%. However, now we are dealing with a 7% mortgage rate.
Monthly supply grew in this report, and this data line has always been crucial for my economic work over the past 10 years.
My rule of thumb for anticipating builder behavior is based on the three-month average of supply:
- When supply is 4.3 months, and below, this is an excellent market for builders.
- When supply is 4.4 to 6.4 months, this is just an OK market for the builders. They will build as long as new home sales are growing.
- The builders will pull back on construction when the supply is 6.5 months.
From Census: For Sale Inventory and Months’ Supply, The seasonally‐adjusted estimate of new houses for sale at the end of September was 462,000. This represents a supply of 9.2 months at the current sales rate.
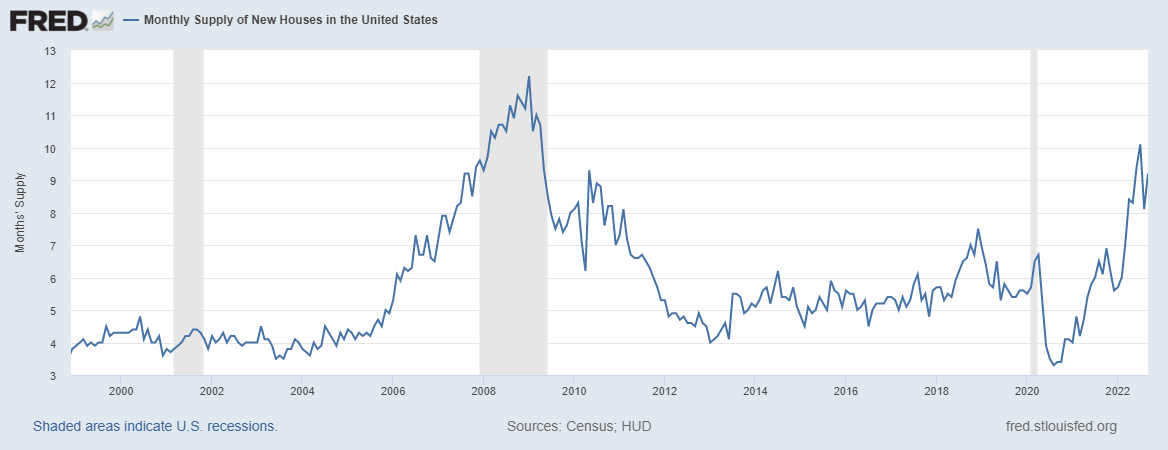
We are far from getting the new home sales sector out of a recession, as the monthly supply is at 9.2 months. This is a big difference from the existing home sales market, where supply has only been 3.2 months, even with the enormous demand this year.
Builders learned their lesson
The other issue with the builders’ supply is that it took forever for the builders to build homes. When rates rose back in March, there was a considerable risk to the business model with many homes under construction.
The builders are dealing with more cancelations this year than last year. With mortgage rates spiking so much in a year, all of those homes that went into contract with rates between 3% to 4% are having issues with rates between 6% and 7%. Some homebuyers simply don’t qualify for the home with the higher rates so their transaction has to be canceled. This is one risk to the builders’ business model: when it takes a long time to finish a home, the rate rise risk is real.
The builders are mindful of managing their supply and demand imbalances. They don’t just put their heads down and build, build and build. They need to have the confidence that they’ll be able to sell the homes that they haven’t even started building yet. So, when mortgage rates rise — and they have in a significant fashion — it hits the the builders’ confidence.
The builder supply picture:
- 1.1 months of supply is finished product
- 6.0 months of supply is still under construction
- 2.1 months of homes haven’t even started construction
We have 56,000 new homes completed for sale. We have 301,000 homes under construction — this is historically high. The number of homes that haven’t even been started sits at 105,000.
For some perspective here, imagine that all the homes that were under construction and those that haven’t even been started yet magically came to the market overnight because Santa Claus and his elves decided to help the builders out for Christmas. Currently, the builders have buyers to occupy those homes, excluding those that cancel the transaction at closing. Assume that all new home buyers cancel their contracts and those homes go into the unsold inventory category, that would push the inventory data up to 1,656,000. Which is still below the four-decade low average of 2 to 2.5 million active listings
NAR Total Existing Inventory: 1,250,000
As we can see, the housing market is still in a recession. New home sales are down so much that the monthly supply levels broke a key area for me to where the builders are stopping their new housing construction with single-family homes.
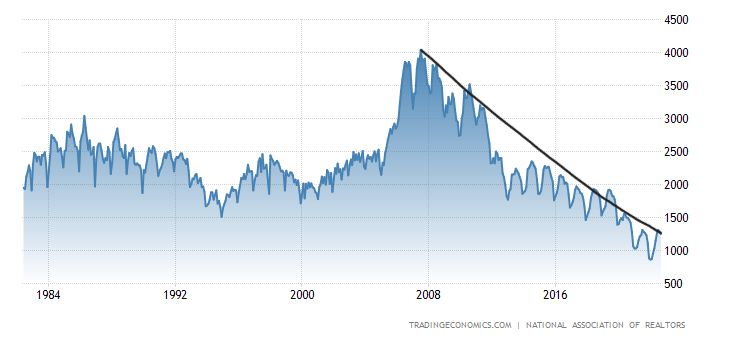
We can also see that we don’t have that many completed homes to start with, and the homes under construction or not even started yet isn’t a big help either. However, the new home sales sector is vital for the economy as construction jobs and big-ticket items are essential here. When rates do fall, we can see that the 5% level brought some buyers into this market. When rates are above 7%, this sector will be more problematic.
For now, the housing recession continues: sales, production, job and incomes within housing all falling together. Until mortgage rates fall, we will still be in this environment. We all should be rooting for the 910,000 two-unit housing that is still under construction to get built out for the rental market. With rental inflation falling, that will impact the inflation data and make the Federal Reserve less hawkish, especially in 2023. However, until rates fall, the new home sales sector will struggle to get supply down and demand up enough to give them the confidence to build more single-family homes.