What's the ultimate vision for your Vermont property? Envision your dream property, whether it's a stunning lakeside retreat, a thriving farm, or a commercial investment. Knowing your goals helps you find the perfect match.
Are you aware of the zoning restrictions and possibilities? Delve into local zoning laws to ensure your grand plans align with regulations. Will you be able to build, expand, or change the property's use as desired?
How accessible are essential utilities? Investigate the availability of water, electricity, gas, and internet services on the land. Are connections readily available, or will costly installations be required?
Ready to embrace Vermont's picturesque tax landscape? Familiarize yourself with property taxes, fees, and potential tax incentives that come with owning land in Vermont. Who wouldn't love some extra savings?
Do you know where your property begins and ends? Obtain a clear understanding of property boundaries and easements to avoid disputes with neighbors and ensure a harmonious community experience.
Is Mother Nature on your side? Assess environmental regulations, flood zones, and protected habitats to guarantee your development plans won't be disrupted by unexpected natural obstacles.
How's the lay of the land? Evaluate topography, soil quality, and drainage to determine if the land can support your intended purpose, be it construction, agriculture or simply enjoying the great outdoors.
What's the neighborhood like? Research nearby amenities, schools, and transportation options to ensure the location complements your lifestyle and enhances the value of your investment.
Are you prepared for Vermont's unique weather patterns? Consider the impact of seasonal changes, snowfall, and temperature fluctuations on your property's maintenance, access, and overall enjoyment.
Ready to uncover hidden gems in Vermont's real estate market? Partner with a local expert who can guide you through the process, provide valuable insights, and help you discover the land of your dreams in Vermont.
Embrace the unparalleled beauty and charm of Vermont's real estate offerings. By answering these top 10 questions, you'll be well-equipped to make an informed decision and embark on an extraordinary journey in the Green Mountain State. So, what are you waiting for? The perfect Vermont property awaits!
Ready to find your dream property in Vermont? Don't wait any longer! Contact our team of experienced real estate professionals today. We're here to guide you through every step of the process, ensuring a seamless and stress-free experience. Let's turn your Vermont land-buying dreams into reality. Click here to get started , or call us at 802-233-4107. Your future awaits in the beautiful Green Mountain State
A paradoxical picture is emerging as the spring market is underway. On the one hand, elevated mortgage rates continue to erode buyers’ purchasing power, and in some markets, home prices are falling. On the other hand, inventory is still low, and homes are still selling fast, often with multiple offers.
All major housing market metrics point to a restrained housing market. The number of new listings coming on the market this spring is lower than it has been in more than a decade. Sales and new pending contracts are below pre-pandemic levels. Buyer interest has increased over the past few months, but showing activity is still much lower than it would be in a typical spring market.
But if you are a prospective buyer, macro housing metrics probably do not reflect your experience. On a transactional level, many buyers are experiencing a housing market that feels very competitive and they are having a hard time reconciling the news about the housing market with their experience trying to buy a home.
What can we expect in 2023?
It is always difficult to talk about the “national housing market” but this year, in particular, there will be wide variation in housing market conditions across the country. At the same time, there are some key trends I think will characterize the housing market in 2023.
1. Buyer disappointment. Home shoppers who are waiting to score a deal are going to be disappointed in 2023. Inventory has increased from a year ago but in most markets, it is still well below pre-pandemic levels. Home prices have come down in some places, but the price correction is relatively modest and prices are still typically 20% or 30% higher than they were three years ago.
Even though the pool of buyers is smaller than it was a year ago, there is still a lot of competition over relatively few homes. Bright MLS’ recent survey showed that sellers in the Mid-Atlantic received an average of 3.4 offers on homes sold in March and more than a third of homes sold for above asking price.
First-time buyers are having the hardest time, competing with higher-income buyers who are offering all-cash or who are able to roll equity for a home sale into a new home purchase. Unfortunately, 2023 is not going to bring much relief to those looking to become a homeowner for the first time.
2. Mortgage rate fatigue. To a certain extent, the presumption that the housing market will live or die with rates is misplaced. The Bright MLS survey found in its recent survey that 7 out of 10 recent homebuyers indicated that rates were not a factor in the decision to buy. Fifty percent of buyers said they were going to buy regardless of rates and about one in five bought with cash. Only 4% of buyers said they were buying now because they believed rates were going to go higher.
Homebuyers, particularly repeat and all-cash buyers, seem to have accepted current mortgage rates as the “new normal.” If mortgage rates rise to 8, 9, 10% or higher, the calculus for these buyers will change. But with rates in the 6 to 7% range this year, mortgage rates might not be as important as conventional wisdom suggests.
3. Selective sellers. New listings activity will continue to be very low throughout much of 2023. However, there are some categories of sellers that could have an impact in their local market.
Who is selling right now? Some people who bought homes in far-flung locations during the pandemic are selling as employers are calling people back into the office. Others who purchased second homes or investment properties during the last few years are looking to cash out amidst projections of a weaker housing market.
Data from Bright MLS’s survey indicated that more than a quarter of homes sold recently in the Mid-Atlantic were rental properties, vacation or second homes, or investment properties. Look for this segment to drive inventory growth in some markets.
4. Atypical seasonality. Home sales will rise throughout the spring and into the early summer, but 2023 will not have typical well-defined seasonal patterns. Economic uncertainty and constrained inventory will keep overall transactions below 2019 levels, and we will also have longer run-ups and wind-downs to the usually busy spring and fall housing markets.
The housing market remains in a period of transition, though sellers still have the advantage. The market will be more balanced in the second half of 2023, but look for a lot of variation across local areas.
In March, a modest bump in homebuyer demand, combined with a decline in for-sale inventory, drove up home prices compared to the month prior. While home prices in many Western and pandemic boom markets are still well off their peaks, 40% of major markets have seen prices return to peak levels, according to Black Knight‘s mortgage monitor report.
Nationally, home prices rose by 0.45% in March on a seasonally adjusted basis, slightly stronger than the revised 0.43% increase from the prior month.
“The strengthening in home prices is the direct result of a second month of modest increases in sales volumes meeting a continually shrinking for-sale inventory,” Andy Walden, Black Knight vice president of enterprise research, said.
Cities in the Midwest and Northeast — Columbus, Ohio (+1.1%); Hartford, Connecticut (+1.0%); Cleveland, Ohio (+1.0%); Cincinnati, Ohio (+0.9%) and Baltimore, Maryland (+0.9%) — saw the largest home price increases, along with Miami, Florida (+0.9), which is leading the South.
The only markets in the top 50 by population where seasonally adjusted prices are still falling are Austin, Texas (-0.7%); Salt Lake City, Utah (-0.12%) and San Antonio, Texas (-0.07%). Phoenix, Arizona and Dallas, Texas are effectively flat month over month.
The annual home price growth, however, continues to cool. Prices were up just 1.0% on an annual basis, a backward-looking metric that has been falling by 1.3-1.4% each month since the start of 2023.
While the annual home price growth rate is on track to fall to roughly 0% by April, low inventory levels will limit just how far that metric will fall in the coming month, Walden noted.
The supply of active listings fell for the sixth straight month in March, marking the lowest level since April 2022. March also saw a deterioration in supply in 90% of major markets.
New listings aren’t filling the gap either. In March, 30% fewer properties hit the market when compared to pre-pandemic norms.
Current available inventory represents just 2.6 months of supply on a seasonally adjusted basis, “tipping the scale back toward sellers in a tightly constricted market,” Walden said.
Despite overall lower mortgage rates compared to March, recent weeks saw a pullback in purchase rate lock volume, according to Black Knight’s report. As of April 26, rates averaged 6.38% for the month, down from the 6.56% average daily rate for the month of March.
Rates remained volatile through March and April – dropping from a high of 6.85% in early March to 6.21% by early April. By mid-April, rates had climbed back up above 6.5%.
Purchase rate lock volume also fell 18% on an unadjusted basis in recent weeks. Refi volume has declined by 17% among cash-outs and by 24% among refi-term refis since mid- to late-March.
In addition, the national delinquency rate dropped 53 basis points in March to 2.92%, falling below 3% for the first time on record dating back to January 2000. The national delinquency rate was also down 13% year over year as of March.
The overall decline in delinquencies outpaced the typical March seasonal improvement of 10.5%, which was attributed to borrowers using tax refunds and other seasonal revenue to catch up on late payments, the report noted.
Prepayment activity rose for the second consecutive month after hitting a record low of just 33 bps of single-month mortality (SMM) in January.
Housing turnover continues to drive the largest share of prepayment activity, accounting for 57% of SMM in March. Nearly two-thirds of the increase in prepayment speeds over the past two months can be attributed to the rise in housing-turnover-related prepayments, which were driven by both seasonal and rate-related pressures.
Seasonal pressures are likely to continue, as housing-turnover-related prepayments typically rise by more than 30% from March through June, which would translate to a 9-bps rise in SMM, according to the report.
Home prices climb amid shrinking inventory, modest bump in demand
In March, a modest bump in homebuyer demand, combined with a decline in for-sale inventory, drove up home prices compared to the month prior. While home prices in many Western and pandemic boom markets are still well off their peaks, 40% of major markets have seen prices return to peak levels, according to Black Knight‘s mortgage monitor report.
Nationally, home prices rose by 0.45% in March on a seasonally adjusted basis, slightly stronger than the revised 0.43% increase from the prior month.
“The strengthening in home prices is the direct result of a second month of modest increases in sales volumes meeting a continually shrinking for-sale inventory,” Andy Walden, Black Knight vice president of enterprise research, said.
Cities in the Midwest and Northeast — Columbus, Ohio (+1.1%); Hartford, Connecticut (+1.0%); Cleveland, Ohio (+1.0%); Cincinnati, Ohio (+0.9%) and Baltimore, Maryland (+0.9%) — saw the largest home price increases, along with Miami, Florida (+0.9), which is leading the South.
The only markets in the top 50 by population where seasonally adjusted prices are still falling are Austin, Texas (-0.7%); Salt Lake City, Utah (-0.12%) and San Antonio, Texas (-0.07%). Phoenix, Arizona and Dallas, Texas are effectively flat month over month.
The annual home price growth, however, continues to cool. Prices were up just 1.0% on an annual basis, a backward-looking metric that has been falling by 1.3-1.4% each month since the start of 2023.
While the annual home price growth rate is on track to fall to roughly 0% by April, low inventory levels will limit just how far that metric will fall in the coming month, Walden noted.
The supply of active listings fell for the sixth straight month in March, marking the lowest level since April 2022. March also saw a deterioration in supply in 90% of major markets.
New listings aren’t filling the gap either. In March, 30% fewer properties hit the market when compared to pre-pandemic norms.
Current available inventory represents just 2.6 months of supply on a seasonally adjusted basis, “tipping the scale back toward sellers in a tightly constricted market,” Walden said.
Despite overall lower mortgage rates compared to March, recent weeks saw a pullback in purchase rate lock volume, according to Black Knight’s report. As of April 26, rates averaged 6.38% for the month, down from the 6.56% average daily rate for the month of March.
Rates remained volatile through March and April – dropping from a high of 6.85% in early March to 6.21% by early April. By mid-April, rates had climbed back up above 6.5%.
Purchase rate lock volume also fell 18% on an unadjusted basis in recent weeks. Refi volume has declined by 17% among cash-outs and by 24% among refi-term refis since mid- to late-March.
In addition, the national delinquency rate dropped 53 basis points in March to 2.92%, falling below 3% for the first time on record dating back to January 2000. The national delinquency rate was also down 13% year over year as of March.
The overall decline in delinquencies outpaced the typical March seasonal improvement of 10.5%, which was attributed to borrowers using tax refunds and other seasonal revenue to catch up on late payments, the report noted.
Prepayment activity rose for the second consecutive month after hitting a record low of just 33 bps of single-month mortality (SMM) in January.
Housing turnover continues to drive the largest share of prepayment activity, accounting for 57% of SMM in March. Nearly two-thirds of the increase in prepayment speeds over the past two months can be attributed to the rise in housing-turnover-related prepayments, which were driven by both seasonal and rate-related pressures.
Seasonal pressures are likely to continue, as housing-turnover-related prepayments typically rise by more than 30% from March through June, which would translate to a 9-bps rise in SMM, according to the report.
Homebuyers are returning to the market in droves as mortgage rates and home prices gradually tick down, according to new data released Friday by Redfin.
Mortgage applications increased in each of the past four weeks over a period ending March 26, according to the Redfin’s Homebuyer Demand Index, the brokerage’s in-house measure of buyer demand. Over the past month, the index jumped to its highest level since May 2022, indicating a surge of activity as the spring home buying season kicks off.
“My phone is ringing, and it’s usually first-time buyers or investors,” San Francisco Redfin agent Ali Mafi said in a statement. “First-time buyers are interested in looking at homes because prices have come down, though they’re still concerned about high mortgage rates. Investors who can pay in cash are honing in on luxury San Francisco condos because prices on those have dropped even more significantly than the overall market.”
While buyer activity is increasing month over month, home sales still sag below levels seen last spring. Pending home sales were down 21.1 percent year over year in February, but have increased monthly for three-consecutive months, according to data from the National Association of Realtors.
Existing-home sales also shot up in February, increasing by 14.5 percent after falling for 12 straight months. Sales remained 22.5 percent lower than 2022 levels, however.
The Redfin report found unequal distribution of price drops across the country due to extremely low inventory, with prices dropping in some parts of the country and rising in others.
Prices dropped in 28 of the 50 most populous United States cities, with the biggest drop seen in Austin where prices fell by 15.2 percent year over year. Following Austin was four Californian cities with San Jose at 12.9 percent, San Francisco at 11.7 percent Sacramento at 11.4 percent and Oakland at 10.8 percent.
In line with a recent trend of home prices decreasing in the West and increasing in the East and Midwest, prices increased the most in Milwaukee where they rose 14.1 percent year over year, followed by Fort Lauderdale at 8.5 percent, Virginia Beach at 6.9 percent, West Palm Beach at 6.7 percent and Providence, Rhode Island at 6.4 percent.
“Prices are still rising quickly in some places while they are down by double digits in big tech hubs, so it’s important for prospective buyers to work with an expert local agent,” Redfin Deputy Chief Economist Taylor Marr said in a statement. “One thing that’s true almost everywhere: It’s difficult to find a desirable, well-priced home for sale, so offer and negotiation strategies differ depending on where you’re looking.”
The national median home sale price fell 1.8 percent year over year to $360,500 during the week of March 26th — the sixth-straight week of annual declines after more than a decade of increases.
The monthly Realtors Confidence Index is an essential measure of what real estate professionals are seeing in their local markets and how the market is evolving on a monthly basis. The National Association of Realtors Research Group has produced the index since 2008, a time of turbulence in the real estate market.
One such measure is who is entering the market. Since October of 2022, the share of buyers who are purchasing their home without a mortgage has been more than one quarter of the market. The share is collected monthly in the Realtors Confidence Index and includes buyers who purchased primary homes, vacation homes and investors.
These all-cash homebuyers are happily avoiding the higher mortgage interest rates, which touched 7% in the fall of 2022 before trending down to the current rate of 6.28%. While spring of 2022 saw a similar share of all-cash homebuyers, one needs to look back to 2014 before seeing similar shares.
Then, the mortgage interest rates were in the low-4% range. In the months before the COVID-19 pandemic, the share of all-cash buyers hovered in the teens. While mortgage rates may be one component, they do not tell the full story. So what happened and who is paying all cash for homes?
One factor at play is the multiple-bid scenarios that took place throughout the COVID-19 pandemic. Homebuyers placed competitive offers on homes while inventory grew increasingly difficult to find. In March of 2022, sellers received an average of 5.5 offers.
Today, the average is 2.7 offers. As buyers wanted to find the perfect property, before interest rates rose, they were willing to offer all cash to sellers so their offer was not contingent on financing.
Additionally, buyers migrated to more affordable locations in low-density areas, allowing them to purchase a home with all cash, if they had housing equity from their past property. Thus, the typical homeowner, who owned their home for a decade, had more than $200,000 in housing equity to make a trade.
The share of non-primary residence buyers is now at 18% from a high of 22% in January 2022. At that time, housing inventory dropped to historic lows making the environment ripe for investors. Investors joined the market to hold properties as short-term or long-term rentals, or to flip the home.
As these all-cash buyers and non-primary residence buyers are finding success in today’s housing market, what is notably lacking are first-time homebuyers. Unfortunately, the share of first-time buyers remained suppressed at just 27% last month. While it is not the high seen during the First-time Home Buyer Tax Credit in 2010, it is also not the historical norm of 40% seen in the annual Profile of Home Buyers and Sellers report.
Notably, during the timeframe of the First-time Home Buyer Tax Credit, there was significantly more inventory than seen today. Unfortunately, the hope of seeing more first-time buyers in the market this year due to the lower competition has yet to materialize as higher mortgage interest rates have suppressed the share who can afford to purchase a home.
First-time buyers today need more housing inventory to improve affordability. The low mortgage interest rates of 3% are not going to be seen any time in the near future. For buyers to afford to enter the market comfortability and sustainably, new construction, office conversion, and reimagining existing spaces such as vacant schools could hold the key.
What is the best news for mortgage rates long-term? It’s getting more supply of apartments! The best way to fight inflation is always by adding more supply; if your goal is to destroy inflation by killing demand, that is only a temporary fix.
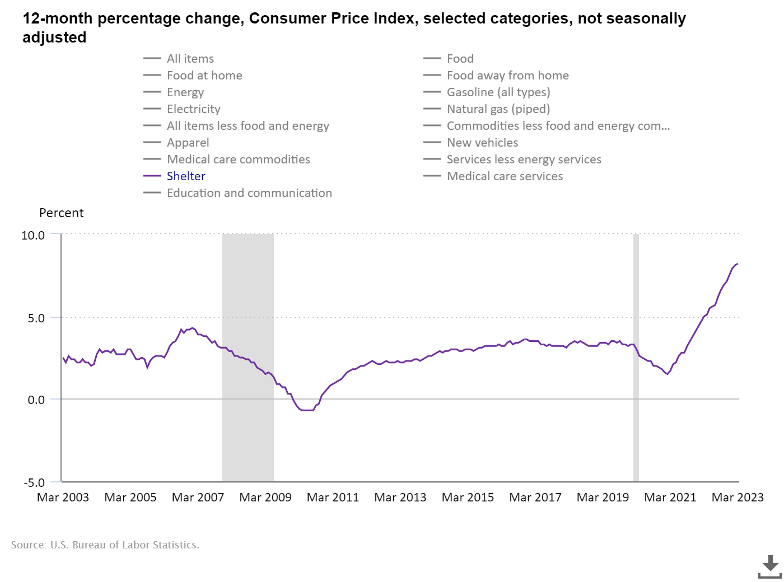
Housing inflation post-2020 was one for the record books, not only because home prices accelerated in such a short time, but more importantly for the inflation data, rents took off, something that didn’t happen during the housing bubble years.
The government accounts for housing inflation by looking at rents, not home prices. The chart below is the CPI Shelter Index, and as you can see during the crazy years of the housing bubble (the gray bar), rent inflation was very tame compared to what we see in the data recently.
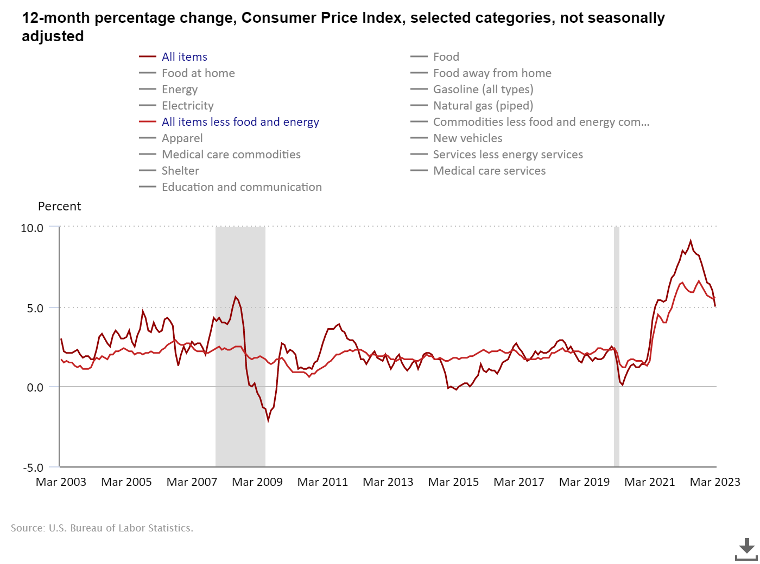
Since 44.4% of the Consumer Price Index is shelter inflation, it’s a massive deal in economics that rents took off in the last two years. Without rents taking off, the CPI data would look much more tame, like what we saw from the years 2000-2019.
As you can see in the chart below, core CPI wasn’t exploding at all this century until COVID-19 hit us. More supply of apartments coming on line will be good news for mortgage rates going forward. The history of global pandemics has always been inflationary early on, as the production of goods gets hit immediately. Then things tend to cool down over time from their inflationary peak level.
Over the next 12 months, the CPI data will account for the real-time cooling down of shelter inflation. And just like the data lagged early on when shelter inflation took off; the opposite will happen over the next year.
Tuesday’s housing starts data does show some promise on the front of attacking inflation and helping lowering mortgage rates, so let’s look at the report and find out what I am talking about.
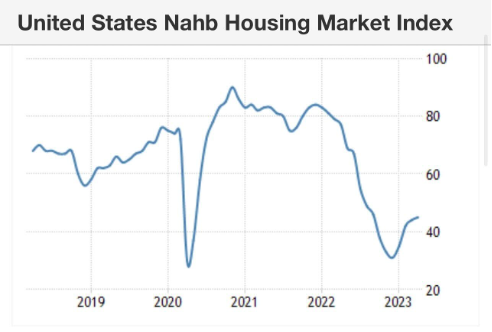
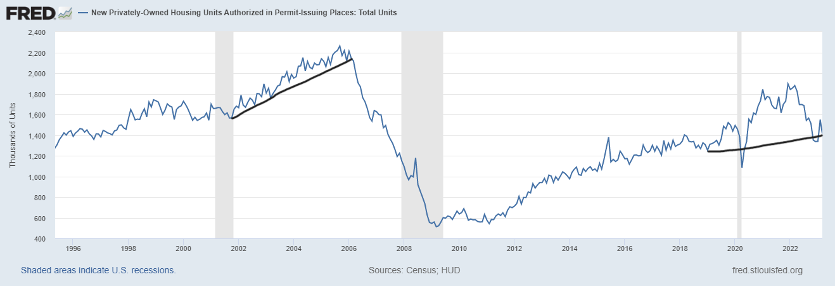
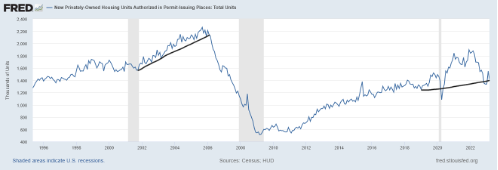
First, however, remember that the housing market is still in a recession, which I wrote about on June 16, 2022. Housing permits have been falling as the builders simply have too much supply to be confident in building homes again. The housing market is still in a recession until housing permits rise in duration. Even though the builder’s confidence index has been rising recently, it still hasn’t led to a significant uptick in housing permits.
From Census: Building Permits Privately‐owned housing units authorized by building permits in March were at a seasonally adjusted annual rate of 1,413,000. This is 8.8 percent below the revised February rate of 1,550,000 and is 24.8 percent below the March 2022 rate of 1,879,000. Single‐family authorizations in March were at a rate of 818,000; this is 4.1 percent above the revised February figure of 786,000. Authorizations of units in buildings with five units or more were at a rate of 543,000 in March.
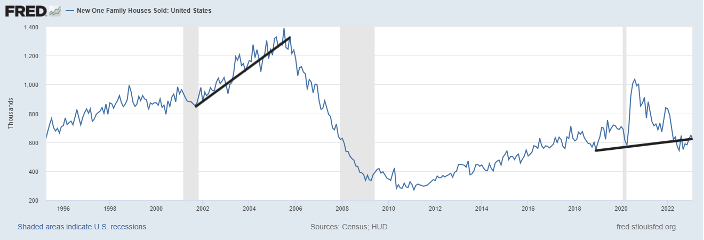
As you can see in the chart below, this looks nothing like the housing peak in 2005 and the crash toward 2008. Back then, housing permits were collapsing as new home sales fell 82% from the peak. Currently, new home sales have been trending better as the builders are taking advantage of low existing inventory. Of course, once we get lower mortgage rates, that should help the builders sell more homes.
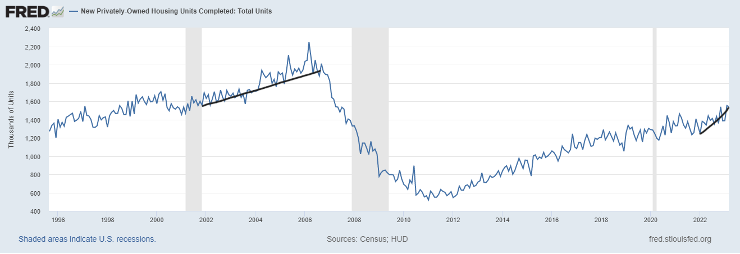
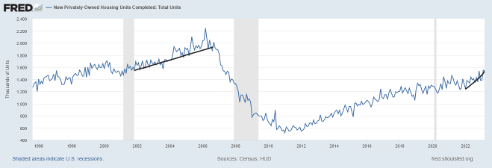
The big difference in this housing recession versus other cycles is that housing completions are still rising, which is unusual. However, because of the COVID-19 delays, we are still working through a backlog of homes under construction.
From Census: Housing Completions Privately‐owned housing completions in March were at a seasonally adjusted annual rate of 1,542,000. This is 0.6 percent (±13.3 percent)* below the revised February estimate of 1,552,000, but is 12.9 percent (±18.6 percent)* above the March 2022 rate of 1,366,000. Single‐family housing completions in March were at a rate of 1,050,000; this is 2.4 percent (±12.4 percent)* above the revised February rate of 1,025,000. The March rate for units in buildings with five units or more was 484,000.
As you can see below, completions are like a slow-moving turtle, but they are still rising, so while housing permits are falling, consistent with the housing recession, housing completions are a different story.
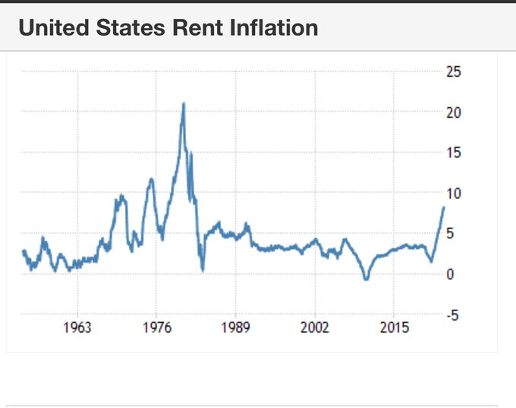
Now the data line that excites me the most, of course, is shelter inflation, meaning the growth rate of rent inflation, because it’s cooling down already. This is something I talked about on CNBClast September on the day the CPI report was being reported.
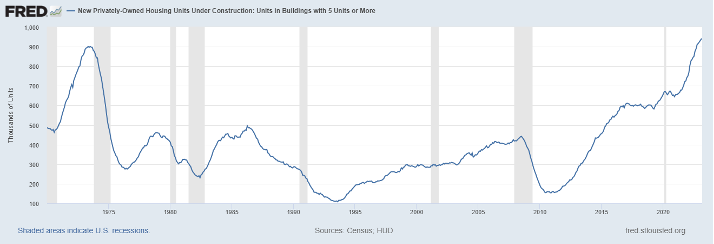
As shelter inflation and wage growth cool down, we are adding more supply, not subtracting. This is key for mortgage rates looking out for years to come. As you can see in the chart below, we have a historic number of 5-unit construction in the works. This is the best way to fight inflation — with supply, with more choices, and landlords having to compete with more supply, preventing them from raising rents faster. The goal should be getting these units out as fast as possible.
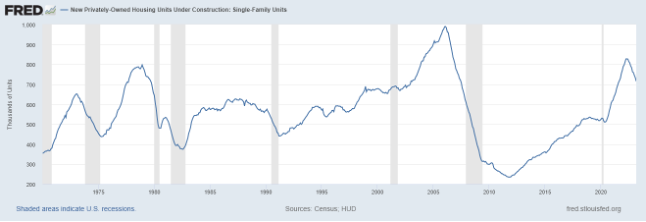
One thing that will likely happen soon is that 5-unit builds under construction will start falling, such as we see with single-family homes under construction. With the Federal Reserve wanting a job-loss recession and banking credit getting tighter, apartment construction should fall like it did in the recession of 1974. I just hope it doesn’t collapse down like it did in the recession of 1974. As we can see in the chart below, the single-family units under construction are already falling as they should.
While the housing starts data doesn’t look like too much is happening and still has a recessionary vibe, we have some positive data in these reports.
As the cost to borrowers rises and credit gets tighter, we should be grateful that we have many apartments under construction. Just imagine if rental inflation wasn’t cooling down in real time, and we didn’t have these apartments in the works — it would look like the 1970s again.
That is the last thing the housing market and the U.S. economy need, rent inflation taking off as it did in the mid and late 1970s. This would mean mortgage rates have room to go higher and stay higher.
As you can see in the chart above, after the burst in housing inflation coming from the 1970s, things started to calm down. You can also see why and how inflation wasn’t a problem this century until COVID-19 hit us. That is the history of global pandemics, inflation data gets wild as supply chains are broken, and then things get back to normal over time.
As broader economic events have taken center stage since last summer, the market has grown increasingly volatile. The Federal Reserve’s ongoing war against inflation remains a source of uncertainty for interest rates and for broader financial markets. It has also increased the likelihood of a modest recession later this year.
Although rates have ebbed from over 7% earlier this year to below 6.5% recently, the cost of borrowing is still significantly higher than it was in 2021 or early 2022. This, together with several noteworthy bank failures, dwindling personal savings accounts and increasing debt utilization, has impacted homebuyer demand, which continues to run below both the 15-year highs of 2021 and the pre-pandemic numbers from 2018 and 2019.
This weakness in homebuyer demand and the ongoing purchasing power impact of higher interest rates has also begun to show up in home prices, which are down on a year-to-year basis for the first time in over a decade.
However, many of the homes sold during the past three years were concentrated in higher-priced segments, which exaggerated home price growth as prices were rising and is now exaggerating the declines as sales of multi-million dollar homes begin to normalize.
However, the recent softness in home prices has raised questions about whether this is, “2008 all over again!” But, despite the undeniable shift in the market after running so hot during the pandemic, many of the ingredients needed for a flood of foreclosures or precipitous price declines look much different than they did a decade ago.
Mortgage underwriting standards were much tighter for the past decade than in the era preceding the 2008 financial crisis. The average FICO score for a new mortgage has averaged more than 700 for the past 10 years consecutively.
Inventory was so tight that homes often went to buyers with large down payments or even all-cash offers. The vast majority of new mortgages were fixed rate loans that were originated or refinanced at the lowest rates of all time. And due, at least in part, to this lock-in effect from a predominance of low-rate mortgages, inventory is still very tight and getting tighter each week.
This represents a significant differentiating factor from the last housing cycle. Back when prices were falling by as much as 50% or 60%, California was at nearly 18 months of housing supply as REOs and short-sales flooded the market. In March 2023, it was just 2.2 months of supply, which is the lowest level in roughly 20 years outside of the pandemic housing crunch.
So what does this all mean for housing in 2023 as we move into the home-buying season and second half of the year? We should expect the number of transactions to remain tepid: demand has taken a breather in the face of higher rates and we do not have enough inventory to support a rapid rebound in home sales.
However, the labor market has yet to falter and despite higher interest rates, the level of rates themselves are not particularly high by historical standards. It is likely that the bigger concern moving forward won’t be, “where are the homebuyers?” but rather, “where are the homes to put them in?” Through that lens, the outlook for prices looks much different than it did during the last cycle.
Although prices are expected to remain relatively soft, we’ve already seen the market heat right back up each time rates approach 7% and then fall back down again. It is reasonable to assume that the extremely low inventory that will prevent home sales from bouncing back quickly will also be the primary factor that prevents more significant price declines from materializing this time around.
Why are the homebuilder stocks up so much? Don’t they know the new home sales apocalypse is here? You know, the one that says we have too much inventory and millions of vacant homes in the U.S.? According to this theory, we have more homes under construction than any time in history. The truth is, it’s not 2008 all over again.
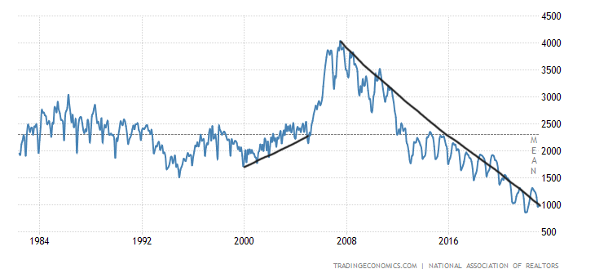
I understand the lure of the housing 2008 story. However, the people who say low inventory is fake news don’t realize that housing credit channels are very different from 2008, which has prevented total active listings from looking anything like 2008.
Certain people on Wall Street like to get ahead of the crowd by being early. In their haste, they miss the bigger picture of the housing market. There is a boring long-term story here about the total active listings being low in America, and I just don’t believe it’s a story that Wall Street wanted to discuss.
The chart below shows the number of active listings since 1982:
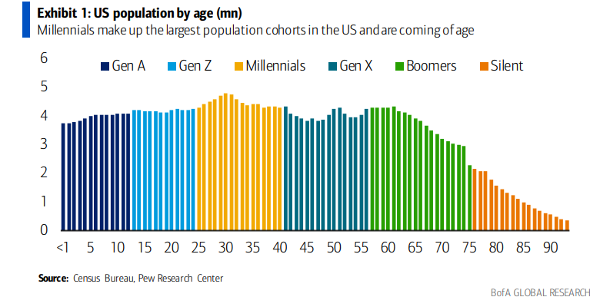
The people who told you demographics in the U.S. are awful and that we resemble Japan were drinking some powerful saki. For years, people said slowing U.S. population growth means we will become Japan, but I’ve been focused on demographics and how that will affect housing from 2020-2024. Concerning the housing economics demand curve, it’s always about the net people living and working.
In reality, housing economic modeling takes a lot of work, and some people instead choose marketing gimmicks to make a name for themselves. It’s very sexy to talk gloom and doom about the housing market, but sometimes that doesn’t end well. I have been highly skeptical of stock traders when they talk about housing economics.
And here is a case in point: New home sales came in Tuesday at a big beat of estimates, but the real story is one about supply and demand.
New home sales
From Census: New Home Sales Sales of new single‐family houses in March 2023 were at a seasonally adjusted annual rate of 683,000, according to estimates released jointly today by the U.S. Census Bureau and the Department of Housing and Urban Development. This is 9.6 percent (±15.2 percent)* above the revised February rate of 623,000, but is 3.4 percent (±12.7 percent)* below the March 2022 estimate of 707,000.
As we can see in the chart below, it’s not like the new home sales market is booming at all; we aren’t anywhere near the top of sales in 2005 or in 2020. However, what has happened is that the housing data has stabilized.
When did this all happen? The forward-looking housing data started to improve from Nov. 9, 2022, with purchase application data, and almost everyone ignored it. The thing is, builders have time to work off their backlog of homes because they’re efficient sellers — they can cut prices, lower mortgage rates and do what they need to do to sell their product, which is a commodity to them. They don’t have the same issues as an existing homeowner because they’re not living in the home they’re selling.
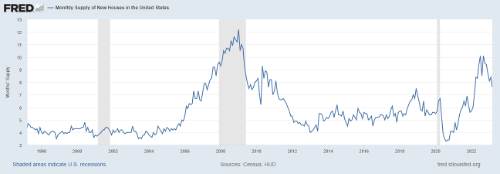
New Home Monthly Supply
For Sale Inventory and Months’ Supply, The seasonally‐adjusted estimate of new houses for sale at the end of March was 432,000. This represents a supply of 7.6 months at the current sales rate.
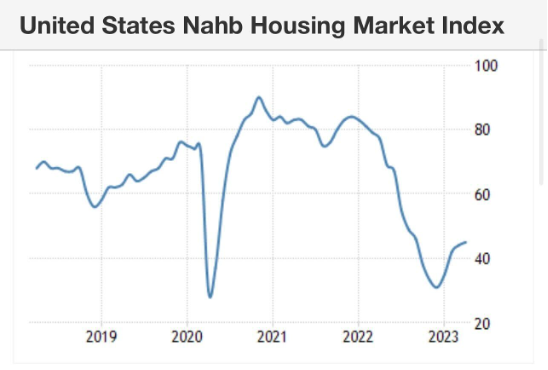
The builders are progressing here; their confidence improves as the monthly supply falls. Context is always crucial with all housing data, and we had a waterfall dive in many housing data lines and bounced from that deep dive.
However, the housing market is still not good enough to start issuing new housing permits. That’s when you will know housing is out of the recession, and when the builders can start building again. It’s that simple.
The data below is a significant improvement for builders, as housing completions are still rising while their monthly supply is falling.
I have a straightforward model for when the homebuilders will start issuing new permits with some kick and duration. My rule of thumb for anticipating builder behavior is based on the three-month supply average. This has nothing to do with the existing home sales market — this monthly supply data only applies to the new home sales market, and the current 7.6 months are too high for the builders to issue new permits with any natural steam.
When supply is 4.3 months and below, this is an excellent market for builders.
When supply is 4.4 to 6.4 months, this is an OK builder market. They will build as long as new home sales are growing.
When the supply is 6.5 months and above, the builders will pull back on construction.
So, as we can see below, the homebuilders are no longer dealing with spiking supply data but a slow-moving downtrend that still needs much work. However, there is a lot more to this the active listing story than meets the eye.
The 7.6 months of supply is broken down this way.
267,000 homes are under construction, still. 4.7 months of supply
94,000 homes still need to start construction. 1.7 months of supply
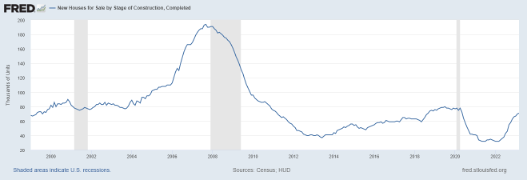
71,000 homes are completed for sale. 1.2 months of supply
No, I am not kidding you; the mass supply increase some people have been talking about is only 71,000. We are far from the peak of supply during the housing bubble crash nears, which was closer to 200,000.
All in all, Tuesday’s new home sales report is consistent with what we have seen in the new home sales data for many months now. The builders are simply taking advantage of the low total housing inventory by doing whatever it takes to move their product, and that is being helped by paying down the mortgage rate for their buyers. Imagine what the total housing market would look like if mortgage rates were at 5% today.
As part of the Housing Market Tracker, we look at seasonal inventory weekly, and hopefully, the seasonal inventory bottom has already happened, as I talk about here.
Regarding Wall Street’s take on the surprise in the new home sales sector, was it really a surprise? Someone had to be buying the builder stocks, right? The reality is that home sales crashed last year and that didn’t create the inventory that some housing experts were looking for last year and this year. This is where understanding how credit channels impact housing inventory would have helped.
Hopefully, my work during my time as a housing analyst for HousingWire has brought some light into this discussion, and this will be more in focus when the next recession hits. However, until then, the Housing Market Tracker data got ahead of this stabilization in new home sales data, and that shouldn’t have surprised Wall Street.
If you're looking for your dream home in the beautiful state of Vermont, you're in luck! Finding your perfect property has never been easier, thanks to the latest technology and online tools. In this post, we'll walk you through our website's different features and benefits for finding homes in Vermont and show you the most effective ways to use them. Whether you're a first-time buyer, longing for a farm, or searching for a luxury estate, our website has everything you need to find your dream home in Vermont.
1. Browse homes, condos, land, and foreclosed properties:
On our website, you'll find an extensive range of property types that suit your needs, from cozy homes to sprawling estates, condos, land, and foreclosed properties. Our site is frequently updated with new listings, so you can always find the latest options that align with your preferences. For instance, you might come across a cozy brick cottage in Jericho or spacious open land in Highgate to build your dream home.
2. Updated MLS database:
Our database is updated every 15 minutes, providing you with the most current listings and property data possible. Say goodbye to the hassle of searching through outdated listings on other platforms! In addition, we regularly post updates on our Facebook page, taking the burden of continuously checking for new listings off your shoulders.
3. Save searches and get email alerts:
The search process can be overwhelming, especially when browsing countless properties. Fortunately, our website allows you to save searches and create customized email alerts for new listings, price changes, sold data, and real estate reports. This feature saves you time and effort and ensures that you are current on the latest happenings in the Vermont real estate market. For example, you could save a search for properties below 15 minutes to a park or property type with four or more bedrooms.
4. Interactive Map Search:
Our interactive map search technology allows you to visualize different neighborhoods and communities in Vermont. This feature provides an interactive and dynamic way to search for your dream home. It also allows you to draw a custom boundary and automatically exclude properties that fail to fall within the constraint, which could save you a significant amount of time as you refine your search parameters.
5. Custom market report:
Understand the Vermont real estate market better with our custom market report feature. This feature lets you view critical insights, up-to-date market trends, and statistics regarding specific locations within Vermont. With a better understanding of the current market, you can make informed decisions and strategic moves that align with your goals.
6. Instant property value assessment:
Before making an offer on your dream Vermont property, you need to understand its value accurately. Our website lets you get an instant property value assessment, ensuring that your offer aligns with the property's worth. An accurate assessment beforehand can save a lot of money while getting the right property at the right price.
Our website has everything you need to find your dream home in Vermont. We have tools like custom market reports, instant property value assessments, and an interactive map search that make the entire search process easier, more streamlined, and enjoyable. So why waste time browsing through countless websites? Let our website help you find your dream home in Vermont. Sign up for email alerts today and stay on top of everything related to Vermont real estate!
Selling a home can be overwhelming, especially if you're trying to do it on your own. You must take all the necessary steps correctly to ensure that you are not making some critical errors. Although it can be straightforward to sell properties in Vermont, homeowners make the same mistakes that ultimately decrease their sale price. This blog will explore the five most common mistakes homeowners make in Vermont while selling their homes without professional assistance.
Overpricing Their Home:
The most common error homeowners commit while selling their property is overpricing. Homeowners tend to overestimate the value of their homes, which ultimately causes them to sit on the market for an extended period. It can lead to selling at a lower price than what would have been achieved if it had been appropriately priced. Consulting with a professional real estate agent can help ensure an accurate valuation.
Neglecting to Make Necessary Repairs:
Understandably, homeowners might think it's not worth fixing something in their home if they are leaving it anyway. However, failing to make necessary repairs can put off potential home buyers, leading to decreased demand for the house. In contrast, making minor repairs or upgrades can increase the home's value and ultimately lead to a quick sale.
Poor Marketing:
Homeowners tend to assume that posting on social media or putting up a 'For Sale' sign is good enough to attract buyers. However, solely relying on social media and not exploring other marketing strategies can limit their reach to potential buyers. Prospective buyers often work with real estate agents, so homeowners must evaluate listing the house on reputable real estate websites.
Incomplete Disclosure:
Homeowners may only disclose some of the necessary information to the buyers, knowingly or unknowingly, leading to legal issues later. Complete disclosure of the property's condition is essential to avoid legal disputes and increase credibility with the buyer.
Being the Point of Contact:
Homeowners might believe that they can handle all the calls and inquiries from potential buyers, but it leads to frustration and miscommunication that can ultimately cost the sale of the house. Professional real estate agents are experienced in handling calls and inquiries and can help streamline the sale process.
Selling a home yourself can seem like a great idea to save money, but it comes with its risks. The top five most common mistakes highlighted in this blog are overpricing the home, neglecting necessary repairs, poor marketing, incomplete disclosure, and being the point of contact. Fortunately, Seller mistakes can quickly be avoided by seeking professional assistance from a real estate agent. At the end of the day, selling your home is a significant financial decision, and ensuring that you correctly follow all necessary steps will ultimately make your experience stress-free and cost-saving.